

Dear Diary… just kidding. This is 2020 not 2002, now we have Twitter for all of our deepest, darkest thoughts!
However, some things are best explained by showing, not telling. When it comes to ~user experience optimization~, I think it’s easier to understand the concept by following a concrete example. So, I’m keeping a record here of the thought process and data behind the changes/improvements I’m making on my own site.
Before we start, I should probably lay out the KPIs I am “optimizing” toward. At this time, I’m not using my website as a means of generating revenue or business leads so my KPIs are purely traffic volume and engagement focused.
Site purpose: To be a useful, informative and entertaining resource for anyone interested in learning about web analytics.
KPIs:
- Total Users – I want to create content that brings users to my site and entices them to share.
- Pages / Session – I want the users who come to my site to read more of my stuff!
- Bounce Rate – I want the content I create to be engaging enough that users don’t immediately leave.
Anchor Links:
May 8
May 14
May 22
May 8 – All about that bass…line

I’ve had traffic to my site for about a week now, and based on the data I have so far here are some of my key observations:
- 77% mobile traffic. I expected a high percentage, but wondered if it might skew more desktop since I shared the blog post via LinkedIn during the work day. Looks like all the time I spent adding custom CSS to make my free WordPress theme more mobile-friendly paid off 🙂
- /blog/ category page was the second most viewed page on my site, with the most viewed being the blog post I shared. I don’t really like how the /blog/ page looks right now, so this is incentive to make it better.
- Bounce rate is chillin’ around 60%, not too shabby. This tells me that in general the site meets the user’s expectation from when they clicked on the link.
- Pages / Session: 1.91. For a site as simple as mine, this is really solid! Users are viewing an average of almost 2 pages per session, not bad considering I have a total of 6 pages live.
- Tracking enhancements:
- Word count tracking for blog posts – Will allow me to look for engagement trends by blog length and optimize my target word count per post, this will take some time before any trends are clear but now the data collection foundation is there.
- Blog post finishes – Event tracking, fires on element visibility of the ‘leave a comment’ block, I can calculate a blog reading completion rate using unique events/unique pageviews.
- Internal link tracking – I can look at the relative frequency of clicks and decide whether I should include more or fewer internal links in future posts.
- Noting the time of day and day of the week I post to LinkedIn – I’m hoping to eventually figure out the optimal time to post by analyzing LinkedIn reach metrics and GA metrics.
May 14 – Doing the thing, scoring the points
- May 8 shared blog post did pretty well – As of May 13 evening, Setting Up Google Analytics via Google Tag Manager had 24 unique pageviews.
- “How to” Content – I’ll need to post a few more how to’s in addition to other content types before I can conclude if there is any clear preference.
- Longer length – at 1202 words, this was not the standard “500 word max” blog post yet so far has a 50% completion rate*?! Wow, that’s a pleasant surprise but likely not an indicator all my content should be long form.
- Not much interaction with internal links. I’m considering altering the CSS back to underlining links, I’ll give it another week or so. Maybe I could A/B test this with Google Optimize…
- Mobile traffic still in the 70%+ range. If you didn’t believe in mobile first, I’m here to tell you: mobile first.
- Bounce rate now around 50%. This is almost suspiciously low, but because I have data confirming users are reading my blog and I’m also not driving any paid traffic to my site, I’m not concerned.
- Total of 49 unique users** in the month of May, maybe I can hit 100 unique users by end of month?!
* Completion rate defined as unique scroll depth completion events on a page divided by unique pageviews
** From my filtered view, which excludes internal traffic (aka me on my various devices)
May 22 – Content is King
- Evergreen content – Last week I shared Digital Lingo, which is more of an anecdotal reference rather than a structured “how to” or narrative experience post. I see this piece as something I will continue to update and repost from time to time in the future. Really the goal is for all of my posts to be considered evergreen, at least until they become outdated due to GA or GTM tool updates.
- User growth – Continuing to see steady growth, and it’s fun to look at the Geolocation dimensions in Google Analytics to see where the users who visit my site are located!

- Blog completion rate – I’m still pleasantly surprised here. I touched on how I planned to calculate this metric in my May 8 entry, here are some screenshots showing the exact set up in GA:

- The key thing to remember here is both metrics (unique pageviews and unique events) must be pulled from the same date range. Because I didn’t publish the blog completion tracking until May 8, I’m only using the pageviews from May 8 – on as well.
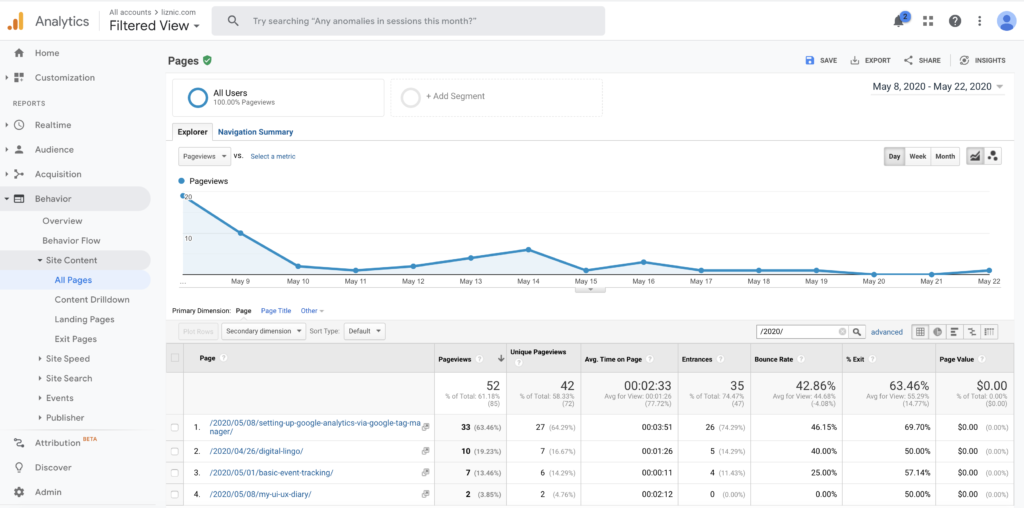
- I present to you: completion rates by post!
- /digital-lingo : 66.7%
- /setting-up-google-analytics-via-google-tag-manager : 44.4%
- /basic-event-tracking : 33.3%